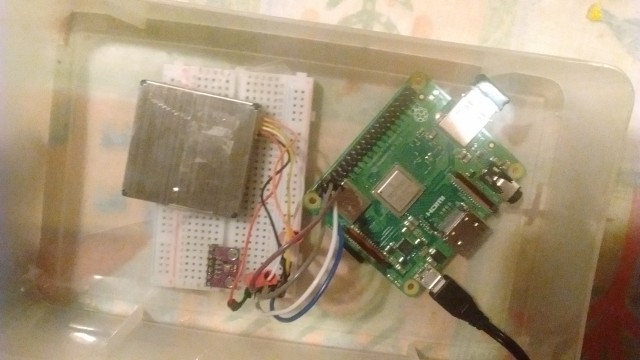
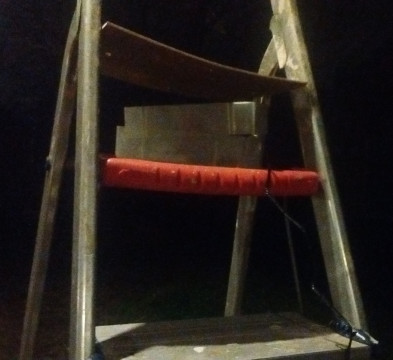
This experiment was hastily put together on December 31st. I had prepared little; I had the sensor only working on a Arduino Uno. I hastily patched everything together on a Raspberry Pi 3 Model A+. I used this library to read data from the sensor. I uploaded the data to an old project of mine I made for a company, which I wrote in crystal-lang. But the language changed a lot over time so I couldn't compile it, I had one sacred binary left. Anyways after many bodges the software worked, and so the race against the clock ended. Then I put it in a lunch container with holes on it and put it on a 1.7 meters tall ladder outside. My father helped me with this, and also lit some fireworks underneath, the results of which you can see here. It finally worked.
In case you don't know, in the Netherlands lots of people like to light fireworks at December 31st and New Year's eve.(funny video about that) Which releases particulate matter. That's why I wanted to do this experiment on this special day.
What is Particulate matter(PM)? It's basically dust. But it's very fine dust, so tiny it enters your lungs. You have PM10, which are particles less than 10 μm in diameter(1 μm = 10-3 mm). These enter deep into the lungs. And you have PM2.5, with a diameter of less than 2.5 μm, which can go through your lung barrier and enter your blood system. Which is not good for your health. Chronic exposure causes all sorts of diseases you don't want. WHO has an article about it in case you want to learn more.
The sensor is a Sensirion SPS30. Keep in mind that all these values are indicative. The sensor is not calibrated; the humidity was above 90% RH the entire day, and the temperature didn't come above 10 °C. The datasheet recommends values between 20-80% RH and 10-40 °C. This is an optical sensor, as far as I know it works by counting particles between 0.3 µm and 10 µm. This means that it does not accurately measure the size of the particles. Worth noting is that PM10 also contains PM2.5, that's why PM10 is always larger than PM2.5.
| WHO guideline max values (2005-2021) | ||
|---|---|---|
| PM10 | PM2.5 | |
| Annual mean | 20 μg/m3 | 10 μg/m3 |
| 24-hour mean | 50 μg/m3 | 25 μg/m3 |
31 December started with fog. Later midday the fog slowly started to disappear and there was a minor wind, this resulted in less particulate matter. At 21:35 I started to light some old fireworks, which reflects the spikes on the graph. The fog slowly started to disappear, a very minor wind (< 2 bft). At midnight there was no fog at all, you could see the stars. This was a good thing, it means that the particulate matter doesn't keep hanging in the air locally and instead blows away. Just after midnight the peak of fireworks commences. For some reason, the spike started on 00:06, perhaps it took a while for the smoke to spread? I don't know. It recovers and then mysteriously at 00:32 there's a peak again, which never quite recovered. Slowly the wind died and the fog appeared again, causing particulate matter to hang in the air. It increased, which baffled me a little. I also checked other calibrated official particulate matter stations and they show a similar pattern, even those in remote areas. In the morning when the sun started to rise the fog slowly died, and the particulate matter levels dropped.
Overall at midnight the levels were way above recommended healthy levels, but relative to other areas I seemed lucky. We didn't have fog at midnight. Worth noting the sensor was on an edge of a village. Maybe people in the village set off relatively low amounts of fireworks? PM10 peak levels of above 400 μg/m3 are common, especially in cities. I did not measure levels of air pollution you measure in cities of underdeveloped nations.
That was the experiment, and I loved to do this. Perhaps in the future I will do more like this.
Update 2020-02-09: A friend of mine told me "nice values and all, but where are the "normal" values for reference?" which is vary fair criticism, I completely did not think about this. It proved to be more difficult than I thought, but you can see a reference here.
Update 2022-01-23: Removed the PM10 since those values are inaccurate. Also converted the data to a different format and added statistics. Also, the maximum temperature recorded on a not-so-far weather station was around ~3.5 °C, and mean RH 96%.