A friend of mine pointed out that I did not have any reference values; it was impossible to tell what was a "normal" day. So I started measuring again.
Similar to December 31st 2019, there was fog. The fog was thicker though, and below or around 0 °C, the freezing point of water. The weather seems to be relatively similar to December 31st. The fog got gradually thinner. The NO2 levels were also high: above 40 μg/m3. The rest of the week: there was a significant high-pressure area; barometer levels were at rare levels for the Netherlands. There was barely any wind. It was either cloudy or foggy, and a high humidity. Particulate matter concentration could not blow away. The PM levels seemed high. I checked with other stations, and many of them have also higher concentrations, although patterns differ. I do not know where these local "bubbles"(such as at 23rd) come from. Also worth noting is that some of these bubbles have a significant discrepancy between PM10 and PM2.5 levels(such as at 24th at 4:00). This is not what was seen on the December 31st. Perhaps traffic? Worth noting I am in an area with a high livestock density; pigs in particular.
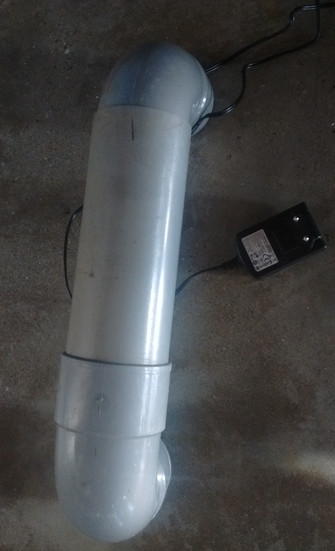
From Sunday on a low-pressure area was creeping up and the levels began to drop. That was when I decided the current setup was not longer adequate to protect if from wind and rain, so I changed the setup and put it in a 80mm PVC pipe that was lying around.
Measuring a "normal" day proved to be more difficult than I thought. Ideally I'd measure a whole year and take the average. For now I have found a map online, these are the average values for entire 2017. The majority of places does not exceed 20 μg/m3. My sensor is in the south-east. On the map of PM2.5 you can see that PM2.5 levels do exceed WHO guideline values however, which is a shame, even though it's not by much. Of course, since the sensor is (on the edge of) a village, concentrations can be higher(people like to burn things sometimes). Using these concentrations, I conclude that on New Year's Eve and the measurements on 22-25 January were abnormally high.
Monday night wind started to blow. The high-pressure area was finally going away. And with it, particulate matter levels dropped to very low levels. I am not sure if true values are this low as shown here, but other stations show also very low concentrations, varying somewhat but all of them < 10 μg/m3 PM10 levels. I am not sure why there was a major data outage in the early hours of Monday. On Tuesday I started to become doubtful of the values the sensor reported, so I moved a pipe corner from vertical to horizontal so that more air was able to pass through. Other stations still reported very low numbers however, so it might not be too far off. Tuesday morning the setup was blown off of the stairs by the wind and fell on the ground. I tried to see if the setup still worked, however, the micro SD card seems bent and you seriously burn your fingers on it when you plug the pi in. Unfortunately I have no backup of the software, which means I will have to rewrite it.
Anyways, here is the data. Every data point you see on the graph is an average of the past 4 data points measured, capped to 4 decimal places after decimal separator. This is because otherwise the graph would be too laggy, plus it saves some bandwidth.
| WHO guideline max values (2005-2021) | ||
|---|---|---|
| PM10 | PM2.5 | |
| Annual mean | 20 μg/m3 | 10 μg/m3 |
| 24-hour mean | 50 μg/m3 | 25 μg/m3 |